
Monitor Dashboard
The Monitor Dashboard is your real-time window into everything happening on your layout. It streams live data as a grid of panes designed for at-a-glance monitoring.
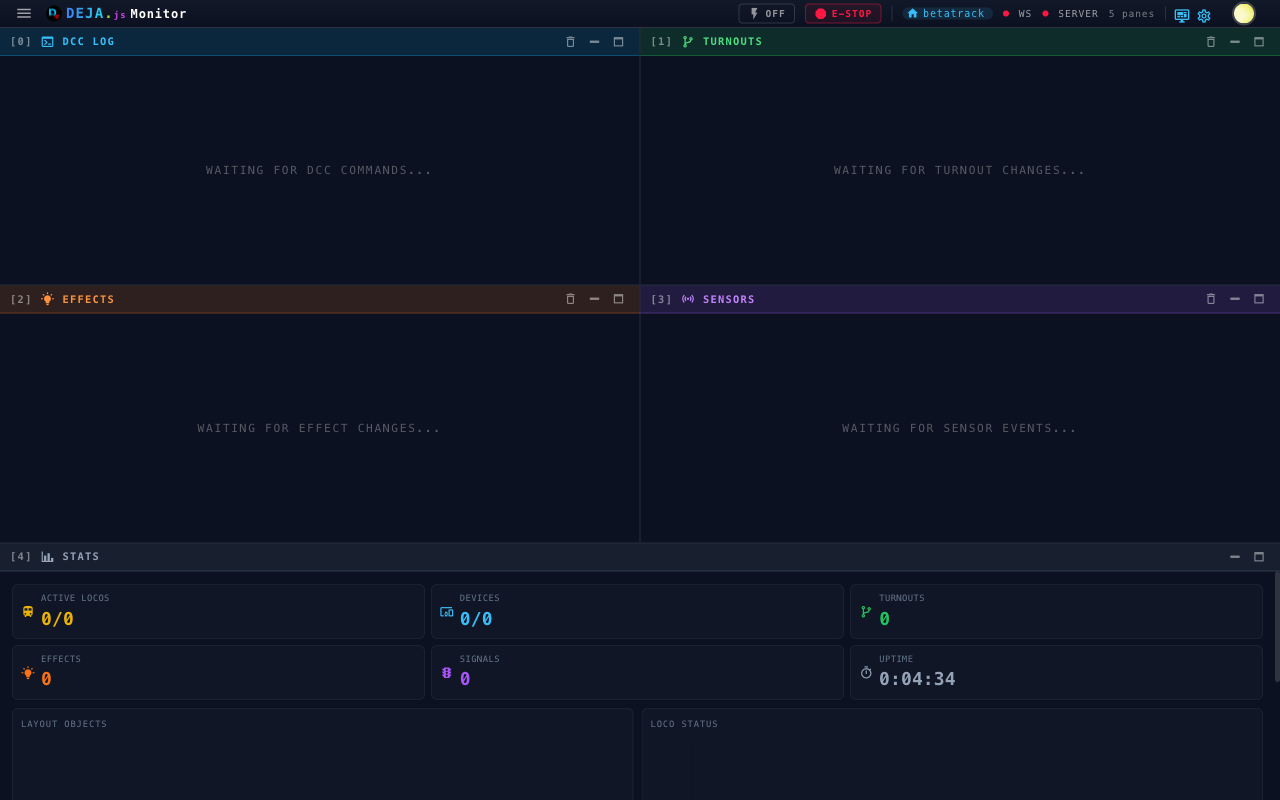
Log Panes
Four live event streams each get their own pane:
| Pane | What you'll see |
|---|---|
| DCC Log | Every DCC-EX command and response flowing through the system, tagged Sent, Received, Info, Error, or System |
| Turnouts | Real-time turnout state changes as they happen — turnout ID and new position (thrown/closed) |
| Effects | Effect activations and deactivations — which effect fired and its updated state |
| Sensors | Sensor (block detection) events as they fire |
Each pane scrolls independently and has a maximize button to enlarge it within the dashboard grid. For a dedicated full-screen view of a log type, use the nav drawer — see Log Viewer.
Device Serial Panes
Each hardware device registered in your layout gets its own pane displaying raw serial communication — useful for debugging hardware issues or verifying that commands are reaching your devices. Open a device's dedicated full-screen serial monitor to focus on a single device.
Stats Pane
The Stats pane summarizes your layout at a glance. Stat cards show:
- Active Locos — Moving locos out of the total roster
- Devices — Connected devices out of the total
- Turnouts, Effects, and Signals — Total counts
- Uptime — How long this session has been running
Two charts round it out: a Layout Objects doughnut (locos, turnouts, effects, signals) and a Loco Status bar (active vs. idle).
Arranging Panes
Panes reflow into a responsive grid — one column on phones, up to four on wide displays. Minimize, maximize, or rearrange any pane, and your layout is remembered between visits.
What's Next
- Log Viewer — Full-screen views for each log type
- Settings — Configure refresh intervals and theme