Monitor App
[!NOTE] Monitor is a fast-follow — it isn't part of the initial DEJA.js release. This page documents what's coming so you know what to expect.
The Monitor app is your real-time diagnostics dashboard. It streams live DCC command logs, turnout, effect, and sensor activity, live stats, and device serial output in a single pane-based dashboard. Use it to keep an eye on system health during operations or to debug issues when something isn't working as expected.
Getting Started
Open monitor.dejajs.com in any browser, log in with your DEJA Cloud account, and select your layout. The dashboard loads automatically and begins streaming live data from your server.
Dashboard
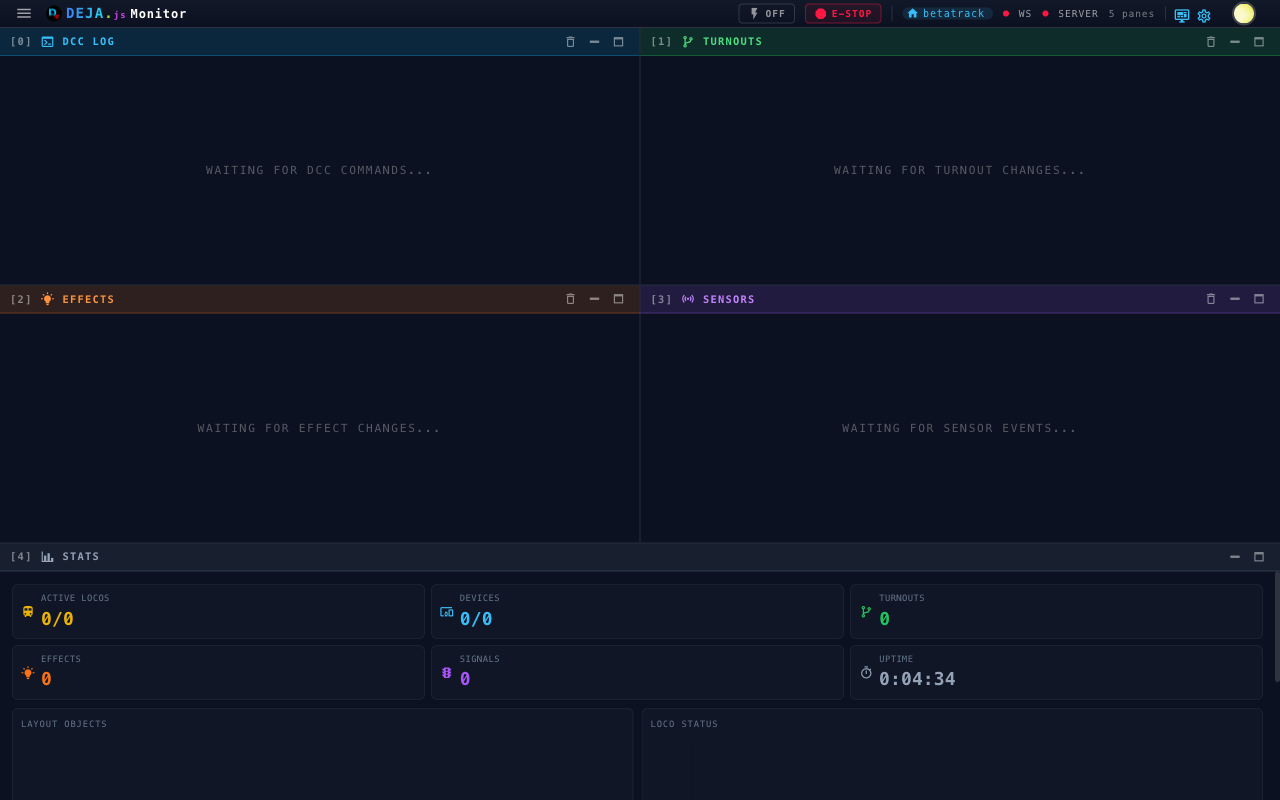
The dashboard is a live grid of panes. Five panes appear by default, and each connected hardware device adds its own serial pane:
| Pane | What it shows |
|---|---|
| DCC Log | DCC-EX commands and responses flowing through the system, tagged Sent, Received, Info, Error, or System |
| Turnouts | Every turnout state change, showing the turnout ID and new state |
| Effects | Effect activations and deactivations as they happen |
| Sensors | Sensor (block detection) events as they fire |
| Stats | Live counts and charts for locos, turnouts, effects, signals, devices, and uptime |
| Device serial | Raw serial communication for each registered device — one pane per device |
Panes reflow into a responsive grid — one column on phones, up to four on wide displays. You can minimize, maximize, or rearrange any pane, and your arrangement is remembered between visits.
Top Bar
A status bar across the top of every screen gives you quick controls and connection state:
- Track Power — Toggle main track power on or off
- E-Stop — Emergency stop for the whole layout
- Layout, WS, and Server indicators — Current layout name plus WebSocket and server connection status
A floating Open Throttle QR code sits in the bottom-right corner of the dashboard, so operators can jump to the Throttle app on a phone.
Access Code
Monitor can display the layout's rotating access code full-screen — handy as a kiosk display near the layout so guests can scan or read the current code. Open it from the Access Code item in the nav drawer or the status-bar icon; the view shows a large countdown ring alongside the code so you can see at a glance how much time is left before it rotates.
Full-Screen Log Views
Each log type also has a dedicated full-screen view. Each view includes a Live indicator — a green chip with a radar icon:
- DCC Logger — All DCC-EX commands
- Turnout Logs — Turnout state changes
- Effect Logs — Effect activity
- Device Monitors — Serial output from all connected devices, or drill into a single device
See the Log Viewer page for details on each view.
Settings
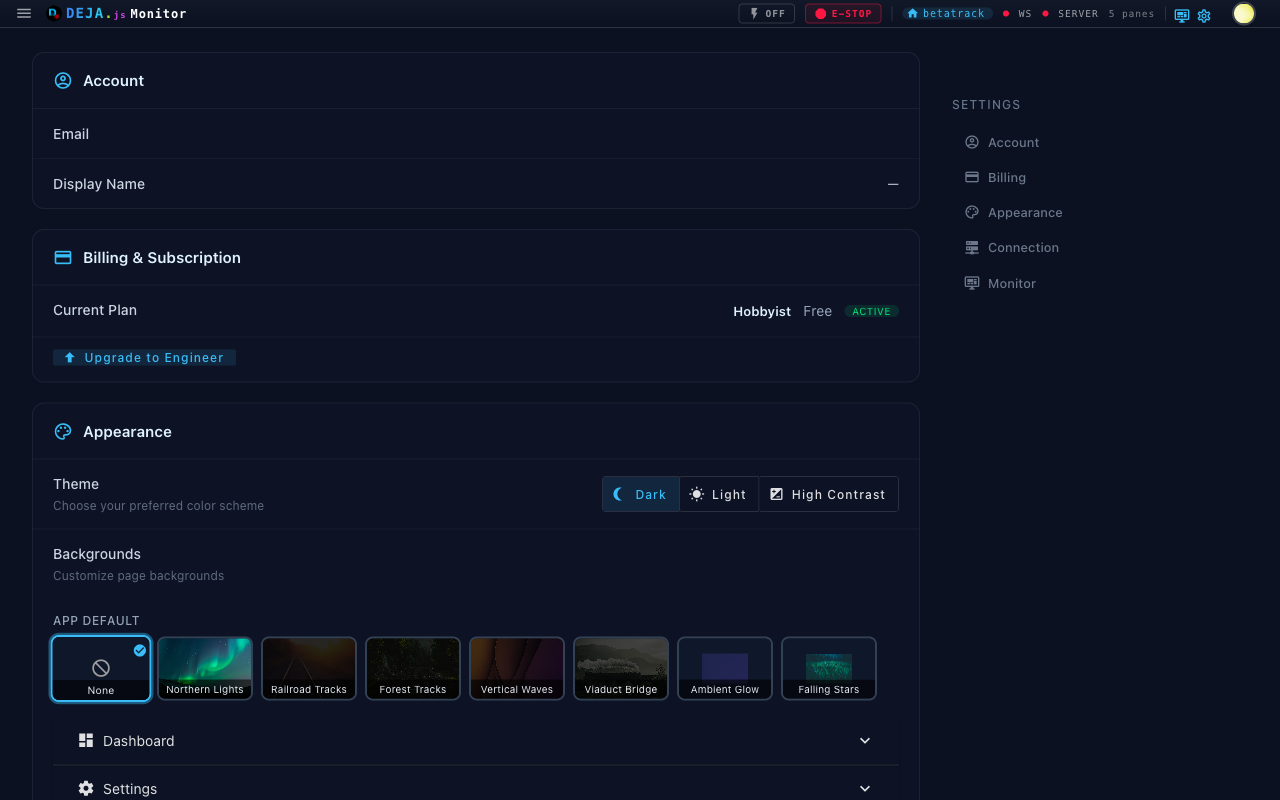
The Settings page provides controls for your monitoring experience:
- Theme — Switch between Dark, Light, and High Contrast (under Appearance)
- Auto-refresh toggle — Enable or disable automatic dashboard refresh
- Refresh interval — Set refresh frequency (5 to 120 seconds)
- Verbose diagnostics — Include detailed diagnostics in log output
The Settings page also covers your account, billing, WebSocket connection, server setup steps, and dashboard backgrounds.